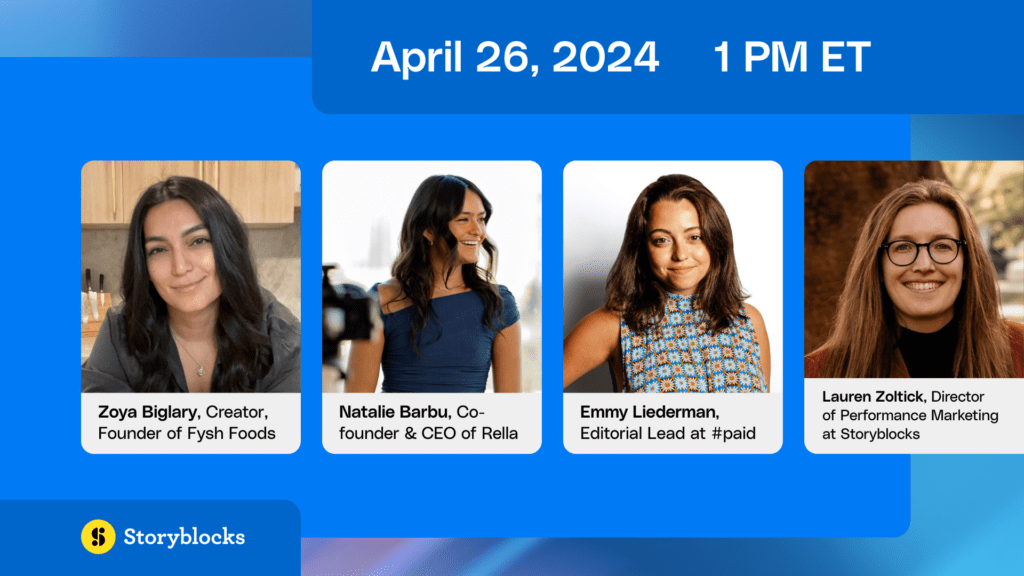
webinar
What businesses can learn from creator-led brands
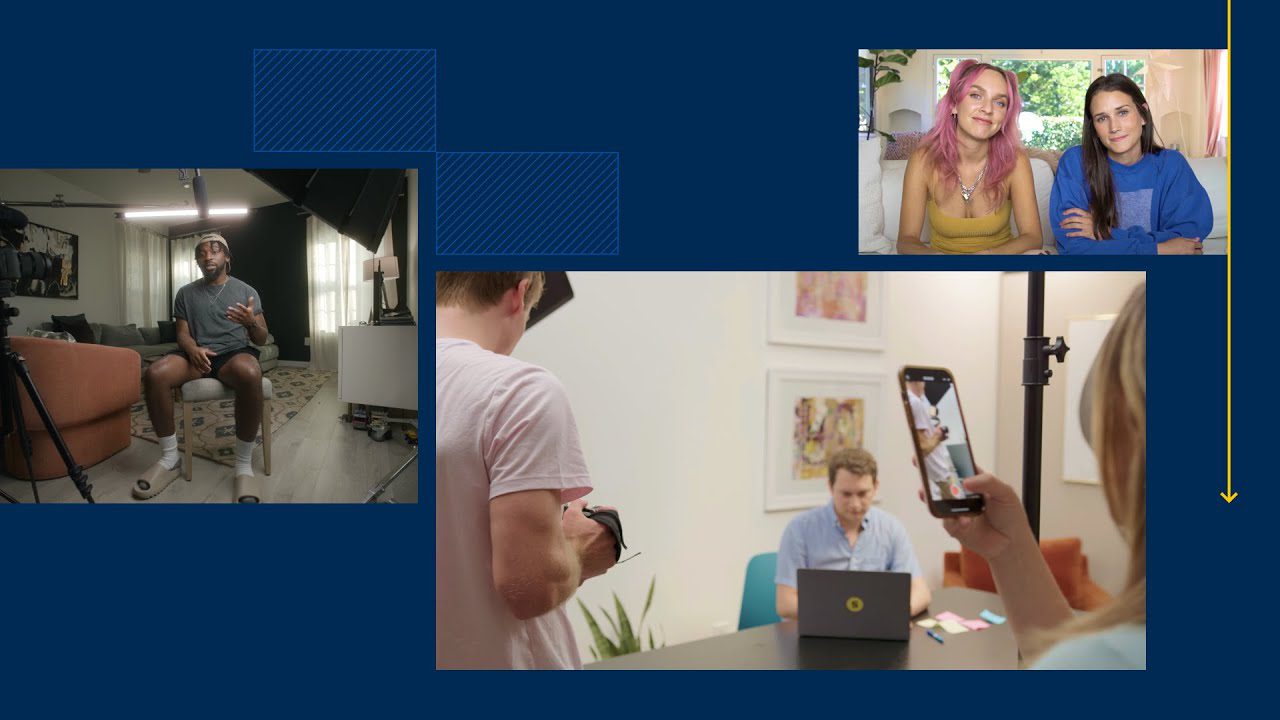
Join us for a conversion on what brands can learn from creator-led businesses.

Join us for a conversion on what brands can learn from creator-led businesses.

Watch live or on-demand webinars featuring industry experts from Google, Hubspot, and more, teaching you how to level-up your skillset.
View more